
Can equity markets and central-bank liquidity provide a usable bitcoin return forecast? This October 8, 2026 study found some explanatory value, but insufficient evidence to adopt a new forecast. The strongest-looking result depended on the sample and the regression window.
The study reconstructs previously documented proxy methods, then tests forward returns chronologically. It leaves the existing bitcoin return assumption unchanged. That decision does not validate the assumption; it means this experiment failed to establish a reliable replacement.
What the liquidity proxy measures
The monthly panel uses actual bitcoin prices from Coin Metrics, adjusted SPY prices from Yahoo Finance, and central-bank series from FRED. It covers January 2014 through September 2026. The descriptive reconstruction uses January 2018 through April 2026.
The research definition of G3 liquidity combines U.S. net central-bank liquidity with European Central Bank and Bank of Japan assets, translated into U.S. dollars. In USD millions:
G3 = WALCL - 1000 × RRPONTSYD - WTREGEN
     + ECBASSETSW × DEXUSEU + JPNASSETS × 100 / DEXJPUS
The subtraction removes reverse repos and the Treasury’s account from the Federal Reserve balance sheet. The foreign components depend on both local balance sheets and exchange rates. Currency translation can therefore change the proxy even when local-currency assets are unchanged.
FRED’s definitions for Bank of Japan assets, ECB assets, reverse repos and Treasury deposits explain the units. This is one liquidity definition, with incomplete coverage of global money and credit.
The frozen protocol records the methods and timing assumptions. The derived results include source URLs, input hashes and forecast diagnostics. The original temporary calculation script was unavailable, so the reconstruction cannot claim an exact replay of the earlier work.
Why the fitted path can look safer than bitcoin
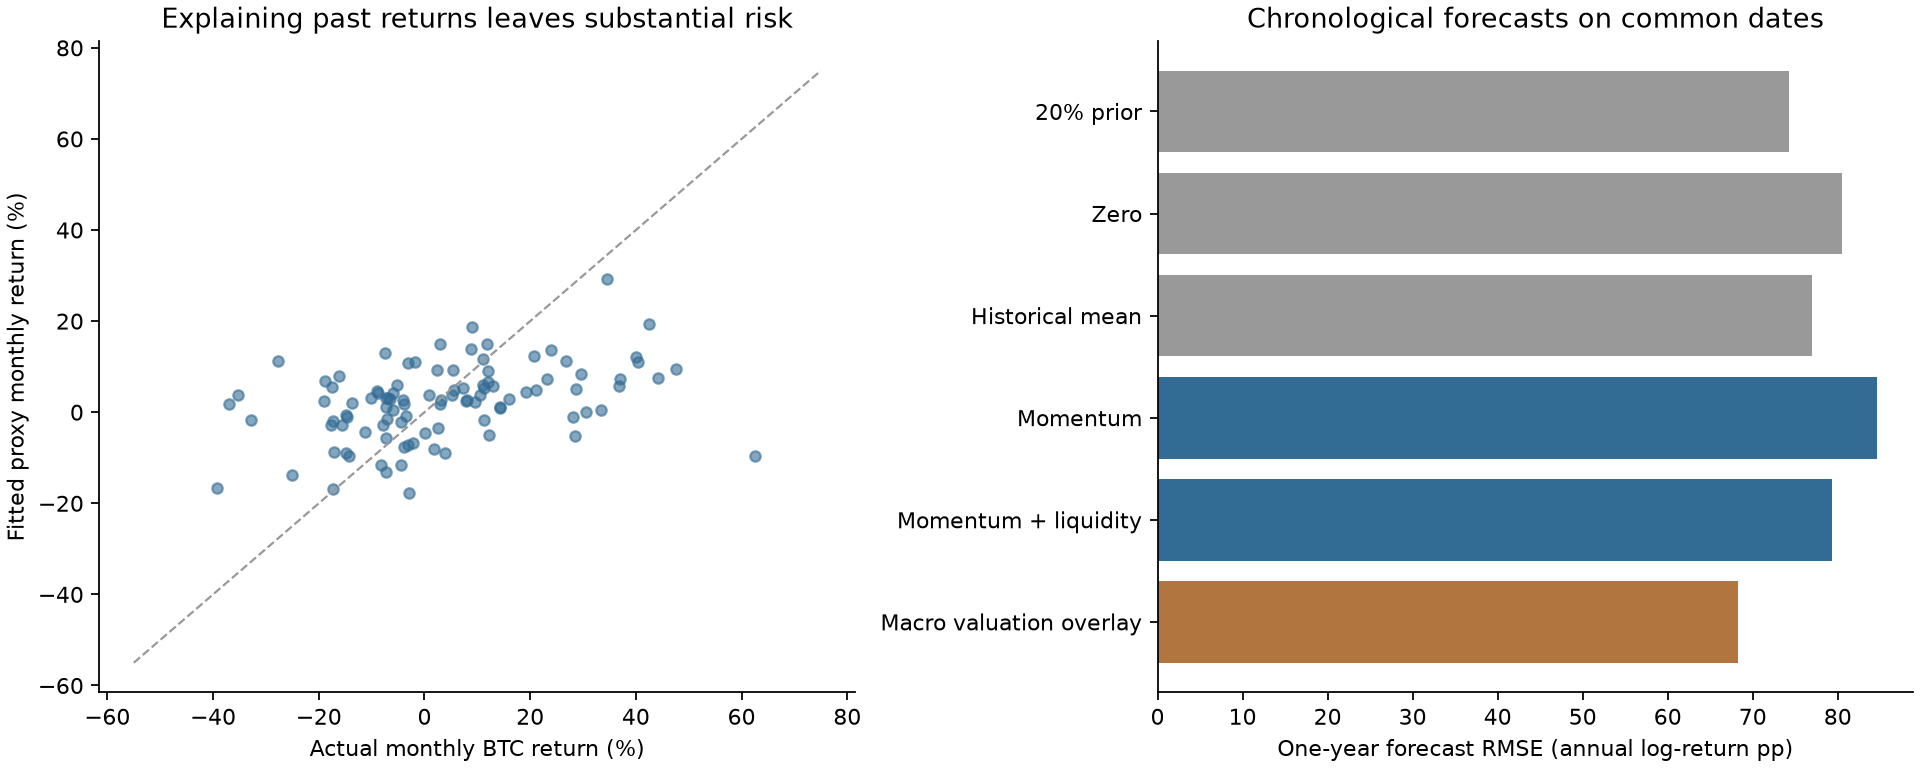
One reconstructed model explains monthly bitcoin returns with contemporaneous SPY returns and three-month G3 growth. Its monthly return R² is 0.155: most variation remains unexplained.
| January 2018–April 2026 measure | Fitted proxy | Actual bitcoin |
|---|---|---|
| Annualized simple-return volatility | 28.6% | 68.2% |
| Maximum drawdown at monthly observations | −49.0% | −75.5% |
The proxy includes only the component explained by its predictors. Using its 28.6% volatility to size an actual bitcoin position would leave out much of bitcoin’s observed risk. A separate model with a SPY/liquidity interaction still leaves about 60.4% annualized residual log-return volatility.
A regression of price levels has R² of 0.924. Trending price series can produce an impressive historical fit while offering weak evidence about subsequent returns. The fit alone cannot establish a stable valuation relationship.
The forward-return comparison
At each forecast date, the momentum models use only training targets whose full one-year or three-year horizons have finished. The valuation overlay fits the preceding 60 months of log bitcoin prices against log SPY and liquidity, excluding the current observation. It then assumes today’s deviation from that fitted relationship closes over the forecast horizon, around a fixed 20% compound-return prior.
That assumed reversion is an additional hypothesis. The regression does not prove that the deviation will close.
| Forecast model | One-year error | Three-year error |
|---|---|---|
| Fixed 20% compound-return prior | 74.2 | 20.3 |
| Zero return | 80.5 | 33.7 |
| Expanding historical mean | 77.0 | 29.4 |
| Bitcoin/SPY momentum | 84.7 | 46.0 |
| Momentum plus liquidity | 79.3 | 42.9 |
| 60-month macro valuation overlay | 68.3 | 18.0 |
Errors are root mean squared errors in percentage points of annualized log return. They are neither portfolio losses nor errors in ordinary compound-return percentages. Smaller values indicate better forecasts on each horizon’s common dates.
Liquidity improves the tested momentum model, but that model still trails the fixed prior. The valuation overlay leads in the main comparison. Its apparent one-year improvement is uncertain: the moving-block bootstrap’s 90% interval for mean squared-error improvement includes zero.
The ranking also changes on the later dates shared with an 84-month valuation window. One-year error is 60.8 for the fixed prior, 71.4 for the 60-month overlay and 85.6 for the 84-month overlay. Extending the window did not produce a stable advantage.
At the September 2026 endpoint, the 60-month overlay implies about 69% one-year compound growth and 35% annualized growth over three years. Those are conditional model outputs from an unproven reversion assumption. They were not adopted as forecasts.
How much independent evidence is available?
The one-year comparison contains 81 overlapping monthly forecasts, from January 2019 through September 2025. The three-year comparison has 34, from December 2020 through September 2023. Adjacent forecasts share most of their return periods.
Dividing the counts by their horizons gives roughly 6.75 and 0.94 nonoverlapping horizon equivalents. This describes the amount of horizon coverage; it is not a formal effective sample size. Thirty-four overlapping three-year forecasts offer little independent evidence about long-horizon performance.
Timing is another limitation. Daily and weekly macro observations receive assumed seven-calendar-day publication delays. Bank of Japan month-end observations receive 14 days. These adjustments use revised data rather than the values actually available at each historical release. SPY’s final trading close and bitcoin’s calendar-month-end price are also imperfectly synchronized.
The IMF’s crypto-cycle research supports a connection between crypto risk and monetary conditions. Earlier Liu and Tsyvinski research found different relationships in an earlier sample. Those findings give context for studying macro exposure; they do not supply a stable bitcoin valuation anchor.
What would justify an allocation signal?
The proxy is useful for exploring conditional stress scenarios, provided those scenarios retain substantial unexplained bitcoin risk. Synthetic returns before bitcoin’s observed history cannot count as additional evidence about bitcoin.
Before an allocation signal could be considered, the research would need historical release vintages, a prospectively fixed specification, stable results across windows and periods, and incremental forecast performance against simple benchmarks. The ELM construction study shows how a fixed policy weight can make portfolio risk explicit while the bitcoin return forecast remains unresolved.